
How To Effectively Manage Your Sales Pipeline Using These 7 Powerful Salesforce Dashboards
The state of your sales pipeline can say a lot about your business.
It can reveal whether or not your sales team will hit their monthly quotas. It can reveal how much revenue the business is forecasted to make over the next quarter. Most importantly, it can even reveal if there are enough incoming opportunities to keep business up and running.
If a sales pipeline is essential to business operations, then it’s no surprise that maintaining one that is clean, full, and effective is crucial for success. That’s why it’s important to create visibility into your pipeline – to not only understand the status of sales efforts, but to help teams plan the right sales activities.
Dashboards have the power to create this visibility and more.
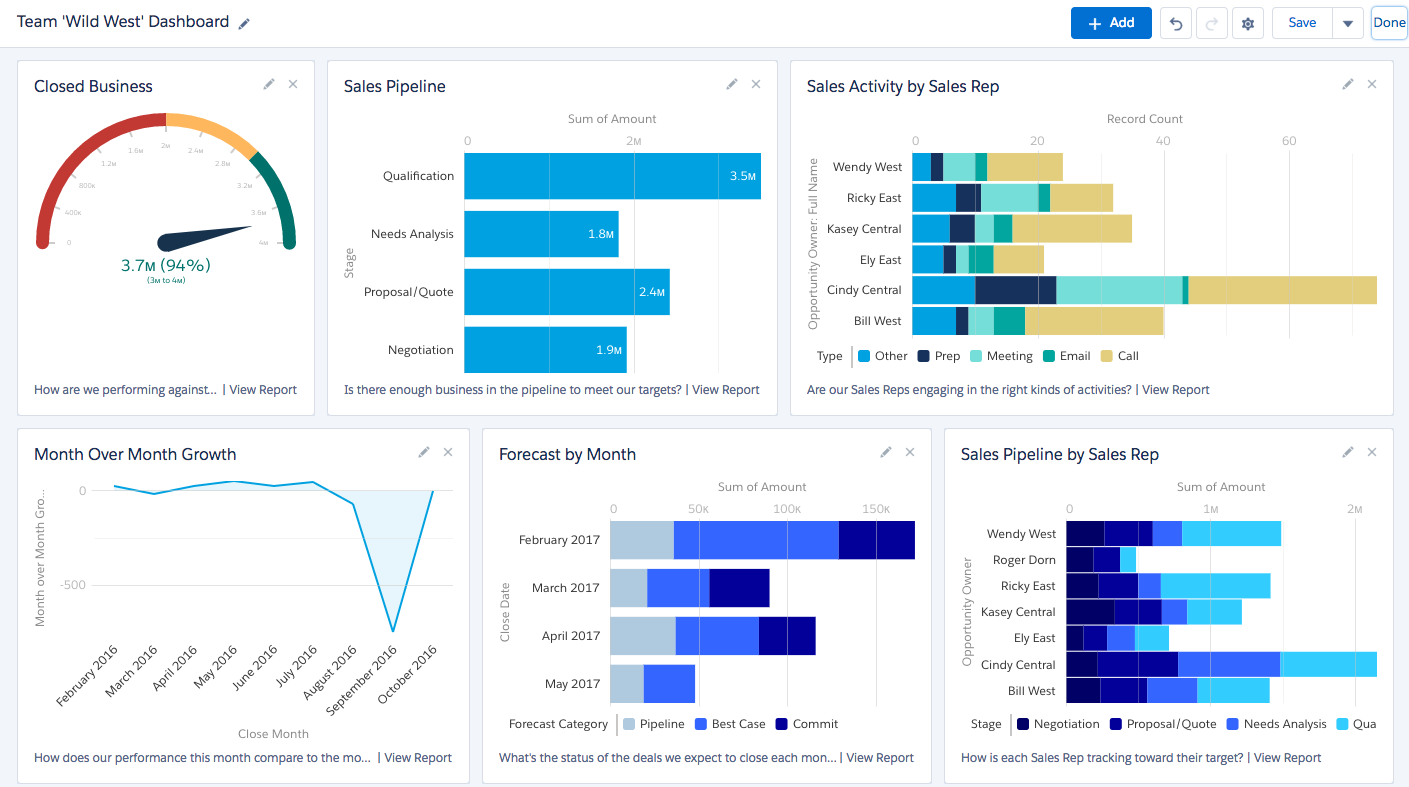
The power of Salesforce dashboards
Salesforce provides access to a wealth of customer and business information, all at your fingertips. Dashboards allow you to organize this information in a meaningful way, enabling sales reps to make better decisions and take action faster. When it comes to your sales pipeline, building the right dashboards has the power to promote accountability, define priorities, and improve forecasting.
But first, let’s talk about data.
Keeping the pipeline squeaky clean
A healthy pipeline starts with clean data, and clean data starts with ensuring data quality standards are in place and teams are on board. In Salesforce, there are several actions teams can take to ensure they’re keeping their accounts up-to-date and as accurate as possible, such as implementing validation rules or checking data sources more carefully. However, how do you hold sales reps accountable for the data they enter–or don’t enter–into Salesforce?
There are a couple of dashboards that are useful in this case: the Data Diagnostics Dashboard and the Clean Your Room Dashboard. The Data Diagnostics Dashboard not only makes it obvious which fields are left blank, but who is responsible for completing said fields. Likewise, the Clean Your Room Dashboard can reveal the quality and reliability of the pipeline by exposing which sales reps aren’t updating their activities and data inside Salesforce.
These dashboards not only hold sales reps accountable, but also ensure that the pipeline is as up-to-date and accurate as possible. When your pipeline is free from errors and inaccuracies, the more it reflects the current state of your business. And the more it reflects the current state of your business, the more accurate your forecasting will be.
Keeping the pipeline full – not clogged
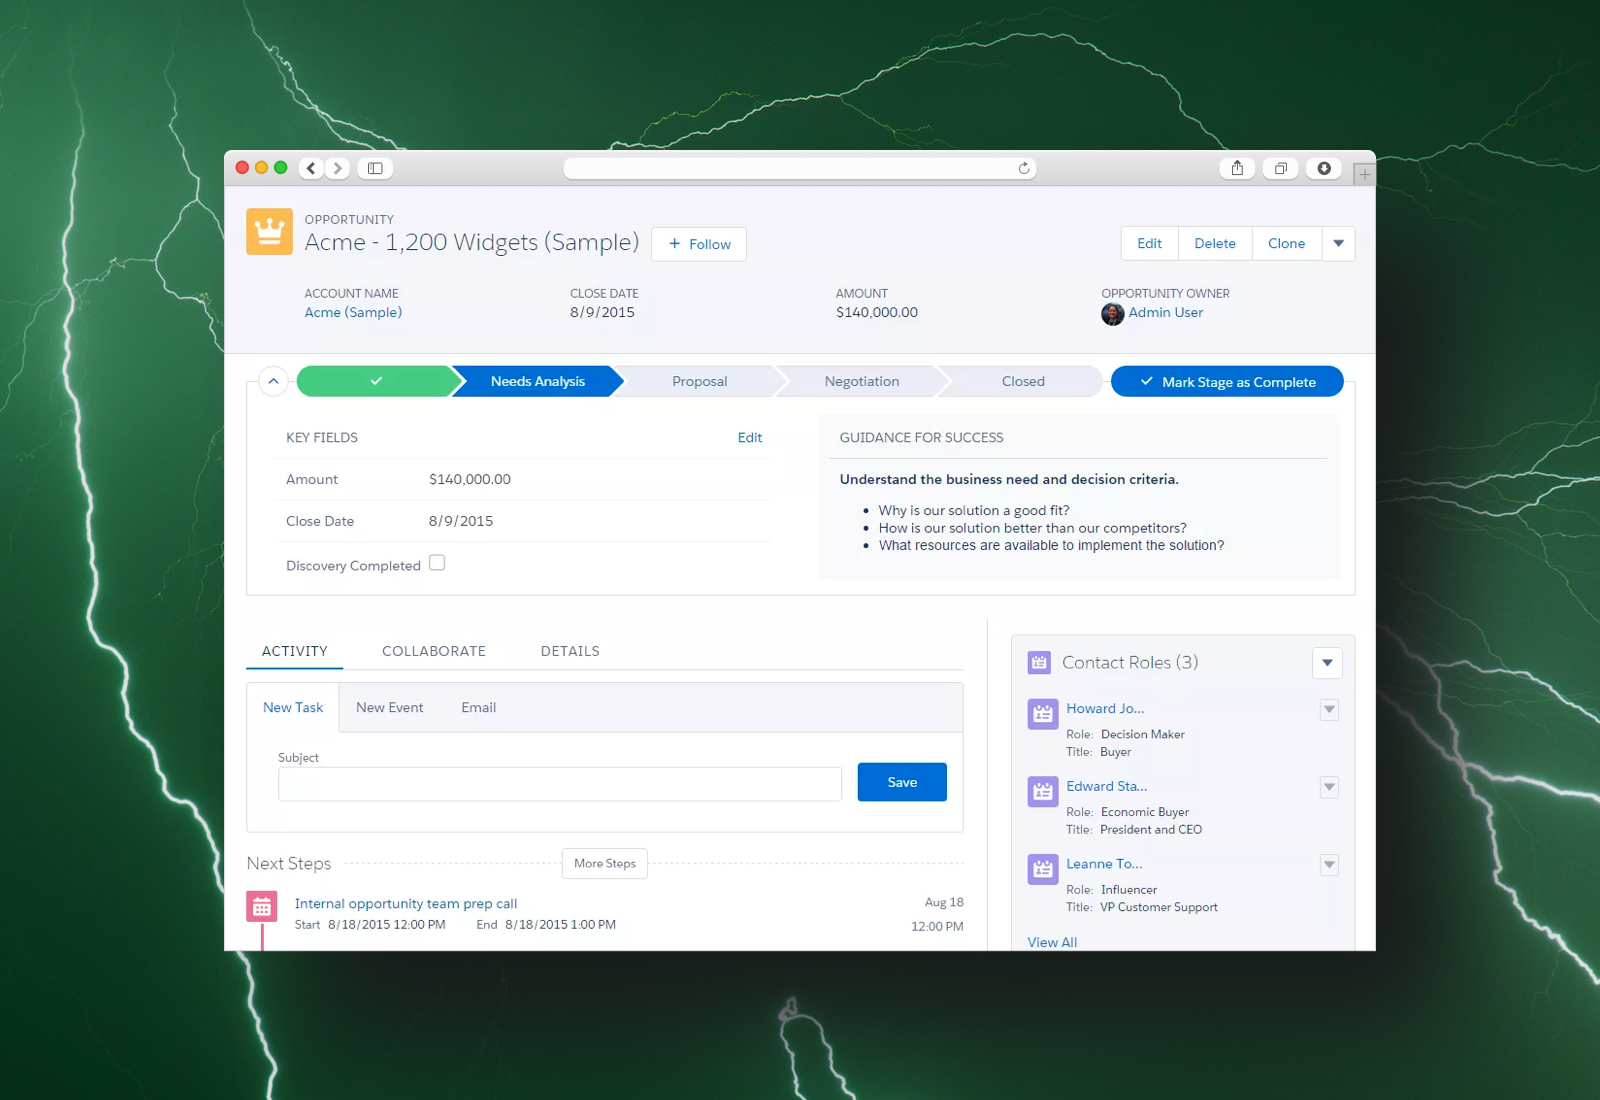
While it’s important to keep your data clean in Salesforce, it’s also important to take action on it. Planning activities around your pipeline is the first step to successful forecasting.
Dashboards can reveal trends and issues, allowing teams to see if they’re not only meeting goals but if there’s enough entering the pipeline. This visibility enables them to be proactive and plan the right sales activities. Likewise, when teams understand what their priorities are, they can focus on doing the task well instead of wondering if they’re doing the right one.
There are two dashboards that can help teams define priorities for a given day or week. The Monday Morning Dashboard allows the sales team to not only understand the results of the previous week, but the current state of the pipeline so they can focus on the right activities. The Daily Pipeline Dashboard is a micro-version of that, drilling down to an individual sales rep’s key activities for the day. This ensures they are aware of and taking action on their priorities in the pipeline.
By properly planning, you can fill your pipeline with opportunities and spot potential clogs. Improved forecasting keeps not only sales reps and teams on track, but business as well.
Keeping the pipeline running smoothly
Creating visibility into data quality and sales activities can help teams accurately plan, act, and forecast. However, true visibility into the sales pipeline comes from results.
Results reveal how your pipeline is working – it contains proof of your successes but also your failures. It can tell you when a certain sales rep is falling behind every week because the pipeline doesn’t have the volume to support their quota. It can tell you when the team is struggling to meet their goals for the third month in a row. Likewise, it can tell you if your sales organization is truly contributing to the success of the business.
When looking at the pipeline, it’s important to measure the results from top to bottom in order to understand the whole picture. This means creating dashboards that show not only the performance of each individual sales reps but also the performance of the sales team and organization as well.
The State of the Union Dashboard is useful to show the highest-level and most important metrics across the organization. The Sales Team Dashboard, on the other hand, is useful in showing not only the successes but the value of the sales team. It can also create some healthy competition by incentivizing reps to fill up the pipeline with the most opportunities. Lastly, the Individual Sales Rep Dashboard is necessary to keep sales reps accountable – if they’re not hitting their goals, then it won’t be a secret for long.
By showing results, sales teams and reps are held accountable for delivering on activities that keep the pipeline flowing. Having this level of visibility into performance may seem intimidating (and might even scare off some sales reps), but ultimately, it’s worth it for the sake of growing your team, your pipeline, and most importantly, your business.

Take control of your sales pipeline
Are you ready to manage your sales pipeline more effectively? Then download your free copy of 7 Salesforce Dashboards You Need To Grow and Manage Your Sales Pipeline today.
These 7 dashboards in Salesforce have the power to unleash actionable insights into your sales activities and more:
- Data Diagnostics Dashboard
- Clean Your Room Dashboard
- Monday Morning Dashboard
- Daily Pipeline Dashboard
- State of The Union Dashboard
- Sales Team Dashboard
- Individual Sales Rep Dashboard
We’ll walk you through the creation of each of these dashboards by outlining the key metrics you’ll need for success. You’ll not only gain insights into your data’s health and sales team’s performance, but you’ll reveal the true state of your business.
Also published on Medium.
— Related Articles —
Related Posts


— Also on Galvin Tech —


Also published on Medium.