
The Most Important Salesforce Report Every Sales Person Must Have
How to Use Salesforce to Build the Most Important Salesforce Report We see it all too often – Sales managers who don’t hold sales people accountable to business specific metrics. Typically […]

How to Use Salesforce to Build the Most Important Salesforce Report
We see it all too often – Sales managers who don’t hold sales people accountable to business specific metrics. Typically we see this because sales managers don’t know what to how to measure what is important to the company and sales organization. Then as a result they don’t create business critical reports in Salesforce. This leads to Salesforce reports that don’t have any relevance or meaning.
Every employee within a company should demonstrate their impact on the business and the results they are producing. This must include sales people too. By implementing the right type of sales reports sales managers can create a culture of daily accountability that leads to receiving better metrics to sell better and sell more.
But where do you start? You can’t create sales reports without a meaningful purpose and reason. If sales people don’t understand the “why” behind the sales report then it will be a challenge for them to embrace it. Building sales reports requires vision, need and specific metrics. At the center of all sales reports is the focus on closed revenue (AKA Quota).
At the beginning of each year every sales person should have a sales quota for the year. But its common that sales people don’t know where they stand to their annual, quarterly or monthly quota. That is why we feel that every sales organization and sales department should track how much in revenue each sales person has closed to their sales quota.
The Most Important Sales Report – The Cumulative Sales Year-to-Date (YTD)
With the Cumulative Sales YTD report sales people and their sales manager can see the progress in achieving the quota for the year.
Example: Let’s say a sales person’s quota is $3.6 million for the year. If we were to divide $3.6 million across 12-months then that would target a monthly quota of $300,000. In the chart below the orange line is the target for the year. The blue line is the actual amount closed year-to-date. As a sales person closes a won opportunity in Salesforce then the blue line will get updated to show where the sales person is to their annual sales quota. As you can see in the example below the sales person started off the year under the targeted $300,000/month. But then as the year went on the sales person was able to grow their sales and go above the targeted line. Then in July there was a dip in closed business and then by September the sales person was able to dramatically grow sales and ended the year well above the $3.6 million dollar quota.

How to Set This Report Up in Salesforce:
Using Salesforce sales people and sales managers can easily create this report by following these steps:
- Click Reports Tab
- Click New Report Button
- Click Opportunities Folder and then the Opportunities report
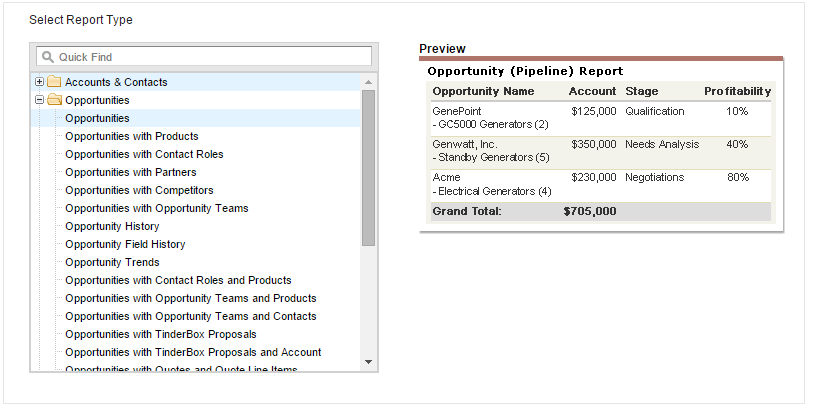
- Click Create
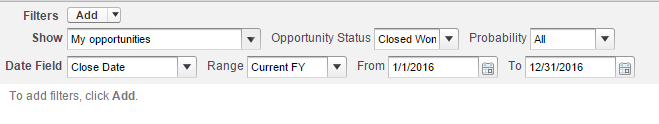
- Now you build the report by selecting:
- Show “My Opportunities“
- Opportunity Status Closed Won
- Probability “All”
- Date Field “Close Date”
- Range “Current FY”
- In the Preview Pane select “Matrix Format” from the format drop down.
- In the Preview Pane you can select the columns you would like to put into the report. At a minimum we recommend the following fields:
- Opportunity Owner
- Close Month
- Amount
- Drag the Opportunity Owner column into the first grouping. This will be a blue shaded area that says “Drop a field here to create a row grouping.“
- Drag Close Month into the blue shaded area that says “Drop a field here to create a column grouping.“
- Drag the # Amount field to the area that says “Drop summarizable fields into the matrix.“
- Click the Sum checkbox and then Apply button.
- Drag the “Add Formula” field into the area that says “Drop summarizable fields into the matrix.“
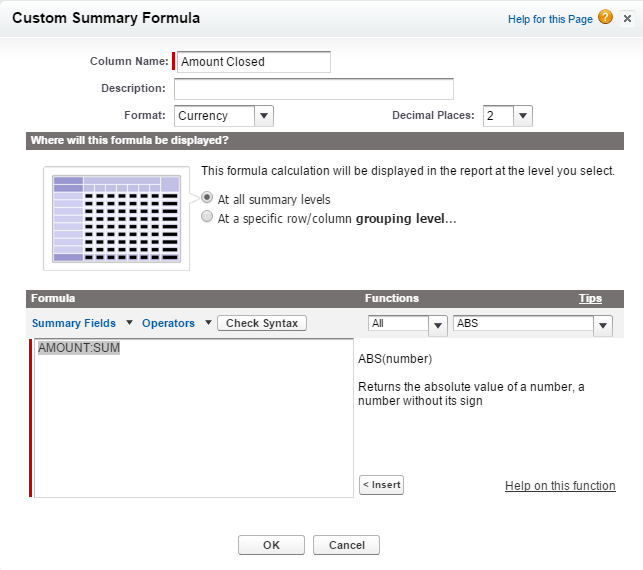
- In the Pop-Up box add the following:
- Column Name: “Amount Closed”
- Format “Currency”
- Where will this formula be displayed At all summary levels
- Formula “AMOUNT:SUM“
- Drag the “Add Formula” field into the area that says “Drop summarizable fields into the matrix.“
- In the Pop-Up box add the following:
- Column Name: “Target”
- Format “Currency”
- Where will this formula be displayed At all summary levels
- Formula “300000” (This is where you will enter your targeted monthly quota. Take your annual quota and divide by 12)
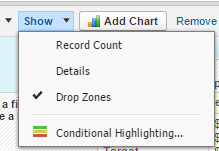
- In the Preview Pane Click “Show” and make sure “Details” and “Record Count” are not checked
The report is now created. Make sure you save it and give it a name. Next, we want to add a line chart to the report.
- Click the Add Chart button
- Click the Line Chart type
- Y-Axis: Amount Closed
- X-Axis: Close Month
- Click the Cumulative checkbox
- Combination charts
- Click the Plot additional values checkbox
- Value: Target
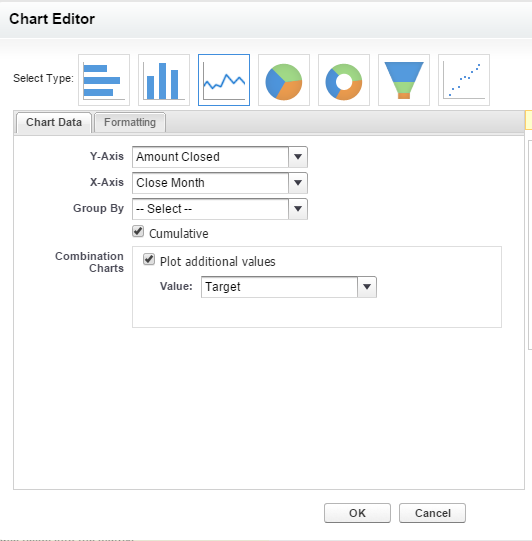
- Click the Formatting tab
- Y-Axis Range set to Automatic
- Legend position Right
- Check the following Data Labels – Show Axis Label and Enable Hover
- Chart Position Above Report
- Chart Size either Medium or Large
- Click OK
- Click Run Report
You should now see your completed line chart above the report itself. Now, at any point you can see how a sales person or a sales team is producing against their monthly and annual quota. This report should be considered the most important report that gets reviewed on not only a daily basis but at every sales meeting.
Also published on Medium.
Share article
— Related Articles —
Related Posts


— Also on Galvin Tech —
Also published on Medium.